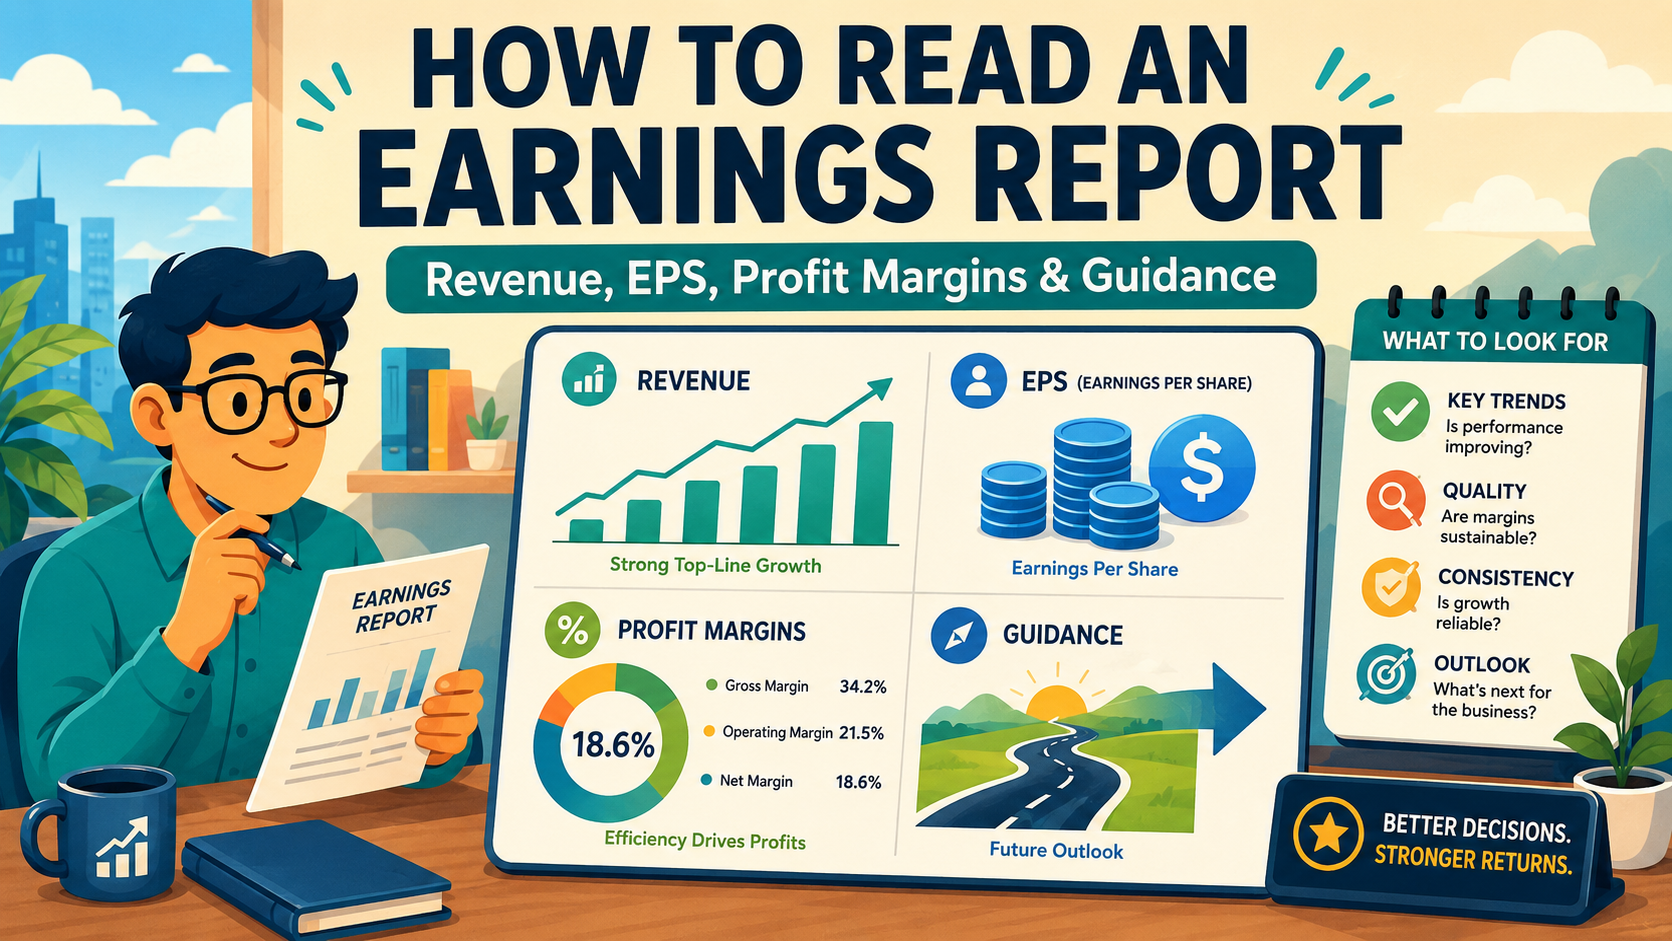
How to Read an Earnings Report: Revenue, EPS, Profit Margins and Guidance Explained
Stock Analysis Guide
An earnings report shows how a company performed over a quarter or year. If you want to understand stocks properly, learning how to read revenue, EPS, profit margins, cash flow and guidance is one of the most useful beginner skills.
Many beginners look at a stock price and ask whether it is going up or down. But the stock price is only the result. To understand the business behind the stock, you need to look at the company’s financial performance.
Earnings reports can show whether a company is growing, becoming more profitable, losing momentum, managing debt well, generating cash or warning investors about future problems.
This guide explains how to read an earnings report in simple language, what the key numbers mean, why stocks move after earnings and what beginner investors should avoid.
What you will learn
- What an earnings report is
- Why earnings reports move stock prices
- What revenue means
- What EPS means
- How profit margins work
- Why cash flow matters
- What guidance means
- How to check debt and the balance sheet
- Common beginner mistakes when reading earnings
Important:
This article is for educational purposes only. It is not investment advice or a recommendation to buy or sell any stock. Individual stocks can be risky, and a company’s share price can fall even when the business reports strong results.
Useful official resources
Helpful outbound links:
SEC EDGAR: Company filings search
Investor.gov: How to read company reports
Investor.gov: Earnings per share
Investor.gov: Financial statements
Related guides on The Trading Journal
Helpful internal links:
What Is P/E Ratio?
How to Start Investing for Beginners
What Is Dollar-Cost Averaging?
Why Markets Move
What Is an Index Fund?
What is an earnings report?
An earnings report is a company update that shows financial results for a specific period, usually a quarter or a full year. It tells investors how much money the company made, how much profit it kept, what costs it faced and what management expects in the future.
Public companies release earnings reports so investors can judge how the business is performing. These reports often include financial statements, management commentary and sometimes a forecast for the next quarter or year.
Simple meaning:
An earnings report tells you how the business is doing, not just how the stock price is moving.
Why earnings reports matter
Earnings reports matter because a stock represents ownership in a business. If the business is growing profits, generating cash and improving its future outlook, investors may be willing to pay more for the stock.
If the business is slowing down, losing money, missing expectations or warning about weaker future growth, investors may become less willing to hold the stock.
Example:
If a company’s revenue is growing, profits are rising and future guidance is strong, investors may see the business as more valuable. If revenue slows and costs rise, investors may become more cautious.
Why stocks move after earnings
Stocks often move sharply after earnings because investors compare the results with expectations. The market is not only asking whether the company did well. It is asking whether the company did better or worse than expected.
This is why a company can report good results and still fall. If investors expected even better numbers, the stock may drop. A company can also report weak results and rise if the numbers were better than feared.
Good company result:
The business performed well.
Good stock reaction:
The result was better than what investors expected.
Revenue
Revenue is the money a company earns from selling products or services before costs are deducted. It is sometimes called sales or turnover.
Revenue growth can show that demand is increasing. But revenue alone does not tell you whether the company is profitable. A company can grow revenue and still lose money if its costs are too high.
Revenue:
The money coming into the business.
Profit:
The money left after costs, expenses, interest and taxes.
Think about it:
If a business sells more every year but spends even more to make those sales, is it really becoming stronger?
Revenue growth
Revenue growth shows whether sales are increasing compared with a previous period. Investors usually compare revenue with the same quarter last year because many businesses have seasonal patterns.
For example, a retailer may make more money during the holiday season, so comparing one quarter with the previous quarter can be misleading. Year-over-year comparison is often more useful.
Beginner tip:
Look at whether revenue is growing year over year, not just whether it increased compared with the previous quarter.
Net income
Net income is the company’s profit after expenses, interest and taxes. It shows how much money the company kept after running the business.
Net income matters because investors ultimately want businesses that can turn revenue into profit. However, net income can sometimes be affected by one-off costs, accounting adjustments or unusual events.
Example:
If a company makes 10 billion in revenue but only keeps 100 million in profit, its margins may be thin. If another company makes 5 billion in revenue and keeps 1 billion in profit, it may be more efficient.
EPS
EPS stands for earnings per share. It shows how much profit belongs to each share of the company.
EPS is useful because companies have different numbers of shares. A large company may earn more total profit, but EPS helps investors understand profit relative to each share.
Simple meaning:
EPS tells you how much of the company’s profit is attached to one share.
Basic EPS vs diluted EPS
Basic EPS uses the current number of shares. Diluted EPS includes the potential effect of extra shares from things like stock options, convertible debt or employee compensation.
Diluted EPS is often more conservative because it shows what EPS could look like if more shares existed.
Basic EPS:
Profit divided by the current share count.
Diluted EPS:
Profit divided by a larger possible share count if extra shares could be created.
Adjusted EPS
Adjusted EPS removes certain items that management believes are unusual or not part of normal business performance. This can help investors see the underlying business, but it can also be misused.
If a company keeps adjusting away costs every quarter, beginners should be careful. Not every adjustment should be ignored.
Beginner warning:
Adjusted numbers can be useful, but do not accept them blindly. Check what the company is excluding and whether those costs keep happening.
Gross margin
Gross margin shows how much money is left after the direct cost of producing goods or services. It is one way to measure how profitable the core product or service is before other business costs.
A rising gross margin can suggest better pricing power, efficiency or product mix. A falling gross margin can suggest higher costs, discounting, competition or weaker pricing power.
Simple meaning:
Gross margin shows how much profit the company keeps after the direct cost of making or delivering what it sells.
Operating margin
Operating margin shows how much profit is left after normal operating costs, such as wages, marketing, research, rent and administration.
Operating margin can show whether the business is becoming more efficient as it grows. If revenue is increasing but operating margin is falling, costs may be rising too quickly.
Improving margin:
The company is keeping more profit from each sale.
Weakening margin:
Costs may be rising faster than revenue.
Net margin
Net margin shows how much of each unit of revenue becomes final profit after all expenses, interest and taxes.
For beginners, net margin is useful because it shows the final profitability of the business. However, margins differ by industry. A supermarket may have lower margins than a software company, so compare companies within the same sector where possible.
Example:
A 5% margin may be normal in one industry and weak in another. Always compare margins against similar companies, not completely different businesses.
Cash flow
Cash flow shows how cash moves in and out of the business. This matters because accounting profit does not always mean the business is generating strong cash.
A company can report profit but still struggle if customers are not paying on time, inventory is building up or large amounts of cash are needed to keep the business running.
Important:
Do not only look at profit. Cash flow can reveal whether the business is actually generating money.
Operating cash flow
Operating cash flow shows how much cash the company generates from its normal business operations. It helps investors see whether the business itself is bringing in cash.
Strong operating cash flow can be a healthy sign. Weak operating cash flow may be a warning sign, especially if the company reports profit but does not produce cash.
Free cash flow
Free cash flow is the cash left after the company spends money on maintaining or growing the business, such as equipment, property, technology or infrastructure.
Free cash flow is important because it can be used for dividends, share buybacks, debt repayment, acquisitions or reinvestment.
Simple meaning:
Free cash flow is the money left after the business pays for the things it needs to keep running and growing.
Balance sheet
The balance sheet shows what a company owns and what it owes. It includes assets, liabilities and shareholder equity.
For beginners, the balance sheet helps answer one important question: is the company financially strong enough to handle difficult periods?
Assets:
What the company owns.
Liabilities:
What the company owes.
Equity:
The remaining value for shareholders after liabilities.
Debt
Debt is not always bad. Many companies use debt to grow, buy assets or fund operations. But too much debt can become risky, especially if profits fall or interest rates rise.
When reading earnings, check whether debt is increasing, whether interest costs are rising and whether the company has enough cash to manage its obligations.
Big warning sign:
A company with falling profits and rising debt can become risky quickly, even if its stock once looked attractive.
Guidance
Guidance is management’s forecast or outlook for future performance. It may include expected revenue, profit, margins, costs, demand, investment spending or market conditions.
Guidance often moves stocks because investors care about the future. A company can beat current earnings but fall if management warns that the next quarter or year may be weaker.
Think about it:
Would you rather own a company that had a good quarter but warns the next year will be weak, or a company that had a weak quarter but says demand is improving?
Earnings call
An earnings call is a meeting where company management discusses the results and answers analyst questions. It usually happens after the earnings report is released.
The earnings call can reveal details that are not obvious from the headline numbers. Management may discuss demand, competition, price increases, costs, supply issues, customer behaviour or future plans.
Beginner tip:
The numbers tell you what happened. The earnings call can help explain why it happened and what management expects next.
Analyst expectations
Analyst expectations are forecasts made by professional analysts. These expectations often become the benchmark that investors compare earnings against.
If a company beats expectations, the stock may rise. If it misses expectations, the stock may fall. But this is not guaranteed because investors also care about guidance, margins, cash flow and valuation.
Example:
A company may beat EPS expectations but lower its future guidance. The stock could still fall because investors worry about what comes next.
Valuation
Valuation is the price investors are paying for the company compared with its profits, sales, cash flow or growth. A great company can still be a poor investment if the stock price is too high.
After earnings, ask whether the new results make the stock look cheaper, more expensive or fairly valued.
Simple rule:
A good business is not automatically a good stock at any price.
How to read an earnings report step by step
- Start with the revenue number
- Check whether revenue grew year over year
- Look at net income and EPS
- Compare EPS with expectations
- Check gross, operating and net margins
- Look at operating cash flow and free cash flow
- Check debt and cash on the balance sheet
- Read management guidance
- Look for comments about future demand
- Compare the results with the stock’s valuation
Quick earnings checklist:
Revenue, EPS, margins, cash flow, debt, guidance, valuation and management commentary.
Good earnings report signs
- Revenue is growing steadily
- Profit is growing faster than revenue
- Margins are stable or improving
- Free cash flow is positive and growing
- Debt is manageable
- Guidance is strong or improving
- Customer demand remains healthy
- Management explains results clearly
- The company is not relying only on one-off gains
- The valuation still makes sense
Bad earnings report signs
- Revenue growth is slowing sharply
- Margins are shrinking
- Profit is falling while revenue rises
- Cash flow is weak
- Debt is rising quickly
- Guidance is cut
- Customer demand is weakening
- Management avoids difficult questions
- The company keeps using large adjustments
- The stock valuation still looks expensive despite weaker results
Beginner warning:
One bad quarter does not always mean a company is finished. But repeated weak reports can show a real trend.
Why good earnings can still make a stock fall
A stock can fall after good earnings if investors expected even better results. This is common with popular stocks where expectations are already very high.
Stocks can also fall if guidance is weak, margins decline, cash flow disappoints or management warns about slower demand.
Example:
A company reports record revenue, but its profit margin falls and management says next quarter will be slower. Investors may focus on the weaker outlook rather than the record revenue.
Why bad earnings can still make a stock rise
A stock can rise after bad earnings if the results were not as bad as feared. Markets move based on expectations.
If investors expected a disaster and the company reports only a small decline, the stock may rise because the worst-case scenario did not happen.
Market rule:
Better than expected can move stocks up. Worse than expected can move stocks down.
Common beginner mistakes
- Only reading the headline
- Ignoring expectations
- Looking at revenue but not profit
- Ignoring cash flow
- Ignoring debt
- Buying because a stock fell after earnings
- Selling because of one bad quarter
- Forgetting to compare valuation with growth
- Ignoring management guidance
- Treating adjusted earnings as automatically better
- Comparing companies from completely different industries
- Assuming a popular company is always a good investment
Beginner example: reading earnings simply
Imagine a company reports revenue growth of 15%, EPS growth of 10%, stable margins, positive free cash flow and stronger guidance. That may suggest the business is growing in a healthy way.
Now imagine another company reports revenue growth of 20%, but profit falls, margins shrink, debt rises and guidance is cut. Even though revenue grew faster, the second company may have more warning signs.
Company A:
Slower revenue growth but stronger profits, margins and cash flow.
Company B:
Faster revenue growth but weaker profits, falling margins and rising debt.
Frequently asked questions
What is the most important number in an earnings report?
There is no single number. Revenue, EPS, margins, cash flow, debt and guidance all matter together.
Why can a stock fall after good earnings?
The results may be good but worse than investors expected, or the company’s future guidance may disappoint.
Is EPS the same as profit?
EPS is profit divided by the number of shares. It is related to profit but not the same as total company profit.
Should beginners buy stocks before earnings?
Buying before earnings can be risky because stocks can move sharply in either direction. Beginners should understand the business and risk before making decisions.
What does guidance mean in earnings?
Guidance is management’s outlook for future performance. It can include expected revenue, profit, margins, costs or demand.
Is revenue more important than profit?
Both matter. Revenue shows sales growth, while profit shows how much money the company keeps after costs.
Quick recap
- Earnings reports show company performance
- Revenue is money coming into the business
- Net income is profit after costs
- EPS shows profit per share
- Margins show efficiency
- Cash flow shows real money movement
- The balance sheet shows assets, liabilities and debt
- Guidance matters because markets focus on the future
- Stocks move based on expectations, not just headline results
Final thoughts
Reading earnings reports helps you move beyond stock price headlines and understand the actual business behind the stock.
You do not need to understand every accounting detail at first. Start with the basics: revenue, profit, EPS, margins, cash flow, debt and guidance.
Over time, you will start to see patterns. Some companies grow sales but struggle with profit. Some produce strong cash flow. Some look cheap for a reason. Some look expensive because investors expect strong future growth.
A good investor does not just ask whether a stock went up or down. They ask whether the business is becoming stronger, weaker, cheaper or more expensive compared with expectations.